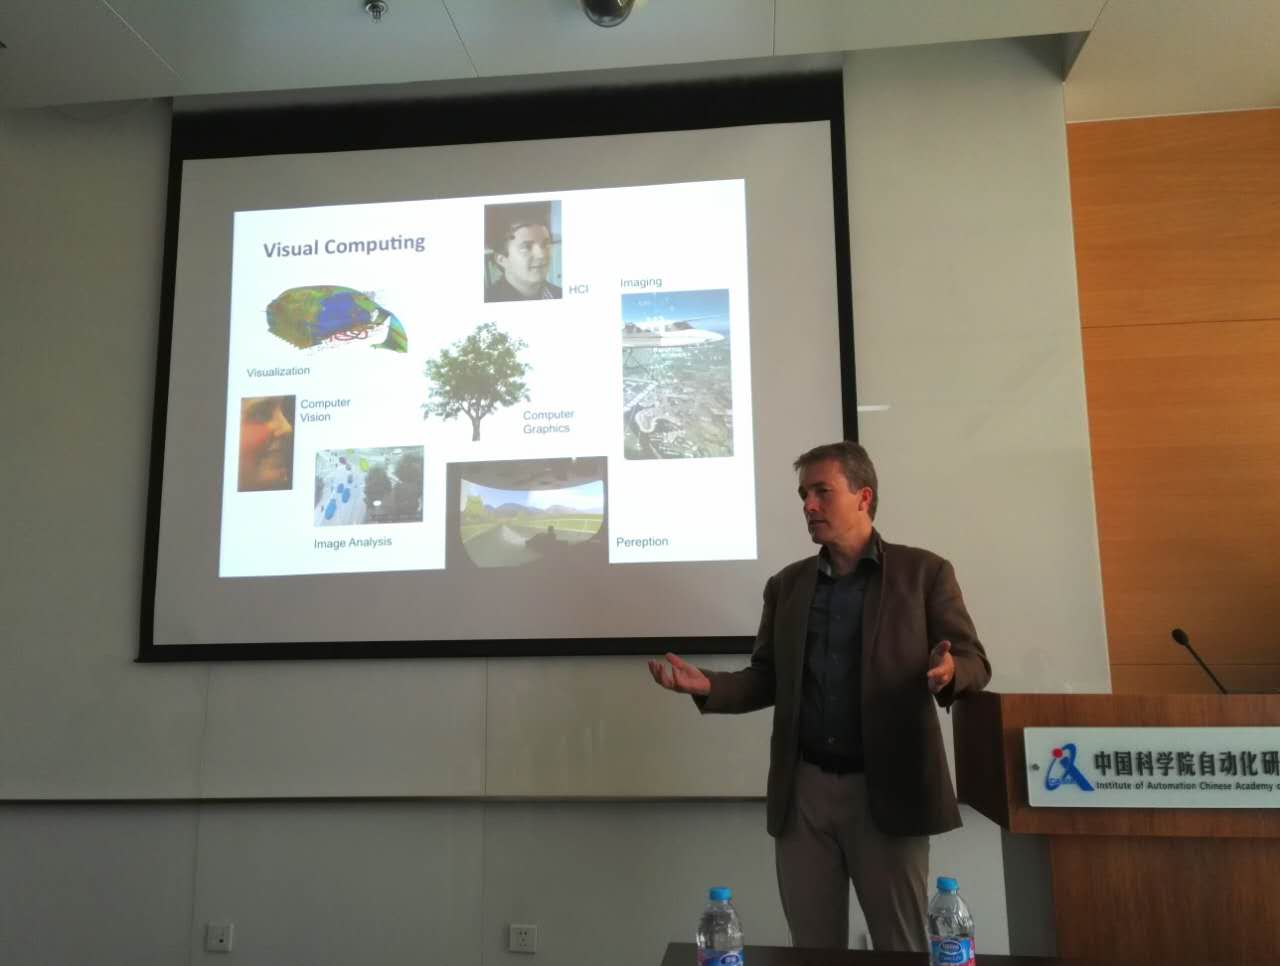
On April 14, Prof. Oliver Deussen of University of Konstanz, Germany visited CASIA and gave a lecture on Quantitative Information Visualization: Dealing with Uncertainty. Prof. Xiaopeng Zhang from National Laboratory of Pattern Recognition (NLPR) hosted the event.
Deussen first introduced the concept of visual computing, which subsumes all “visual” techniques working on images in some way or another. Typical subfields of visual computing include Computer Vision, Image Analysis, Computer Graphics, Perception, etc. Previously, the subfields were rather separate, but we have been witnessing a successful trend to combining the subfields. A successful cross-subfield example is visual analytics, which combines visualization, HCI and machine learning. However, “we have been witnessing much focus on qualitative methods and evaluation”, Deussen said. Then he used an example of the colour map of the mean temperature distribution from IPCC to illustrate this idea. He stated that quantitative method is important by showing that the color map can comes with misleading information when it is changed.
Deussen summed up the general process of visual computing, namely: data acquisition, data analysis and processing, discovering knowledge through information visualization. Then, the quantitative analysis method of visual calculation was introduced for visual difference predictors and the visualization of uncertain information. Especially for the latter, he introduced how to quantitatively analyze the uncertain information in the probability graph and the hierarchical data. At the end of the talk, Deussen hopes that through the quantitative analysis of data visualization, we can find the rules from these interesting and large-scale data to inspire and promote the discovery of new scientific knowledge.
Deussen answered question on quantitative and large data visualization technology, dynamic information visualization research, comparison and selection of different visualization methods, and the advantages and disadvantages of 3D visualization technology. The lecture further deepened the understanding of the concept of information visualization and the common analysis methods, which will provide reference and inspiration for the follow-up research on large data visualization.

Prof. Oliver Deussen Gives Lecture
BIOGRAPHY of Prof. Oliver Deussen:
Prof. Deussen graduated at Karlsruhe Institute of Technology and is professor at University of Konstanz (Germany) and visiting professor at SIAT (Chinese Academy of Science) Shenzhen. In 2014 he was awarded within the 1000 talents plan. 2012-2015 he served as Co-Editor in Chief of Computer Graphics Forum, currently he is Vice-President of Eurographics Association. Besides information visualization, his interests are modeling and rendering of complex biological systems as well as non-photorealistic rendering. He also contributed papers to geometry processing, sampling methods, and image-based modeling.
(By Jianwei Guo, National Laboratory of Pattern Recognition (NLPR))

